When LLMs Become Scientific Instruments: Groundsource Flash Flood Research Report
Deep Literature Analysis
A deep-dive into Google's 2.6-million-event flood dataset: what the data actually shows, what claims hold up, and why the methodology may matter more than the dataset itself.
Resources: Enriched Dataset | Full Interactive Article | Original on Zenodo
What is Groundsource?
In February 2026, Google Research released Groundsource — an open-access global dataset of 2.6 million historical flood events extracted from news articles using Gemini LLMs. The dataset was published on Zenodo alongside a comprehensive preprint on EarthArXiv (Mayo, Zlydenko, Bootbool, Nearing, Cohen, et al.).
Google used Gemini to scan 5 million news articles across 80+ languages and generated 2.6 million geo-tagged flood events spanning 150+ countries. This dataset serves as the foundational ground-truth training archive behind Google's operational flash flood forecasting system.
The best existing global disaster databases (such as GDACS) contained roughly 10,000 flood events, primarily capturing catastrophic macro-disasters. If Groundsource genuinely delivers 2.6 million validated, localized events, that's not an incremental improvement — it's a demonstration that LLMs can convert unstructured global journalistic archives into structured scientific ground truth.
We downloaded the full dataset, decoded every geometry, and benchmarked its claims against the underlying EarthArXiv preprint and external observational archives.
What the Data Actually Shows
The dataset is distributed as a single 667 MB Parquet file containing exactly 2,646,302 flood events. Each record contains a UUID, polygon boundary (stored as WKB geometry), area in km², start date, and end date.
Key Numbers
| Metric | Value |
|---|---|
| Total events | 2,646,302 |
| Null values | 0 |
| Duplicates | 0 |
| Date range | 2000-01-01 to 2026-02-03 |
| Median area | 2.05 km² |
| Mean area | 142.0 km² |
| Peak year | 2024 (402,012 events) |
What's Absent
No country column. No source article URL. No language tag. No confidence score. No human casualty or severity classification. The published dataset is intentionally minimalist — strictly geometry, start date, end date, and area.
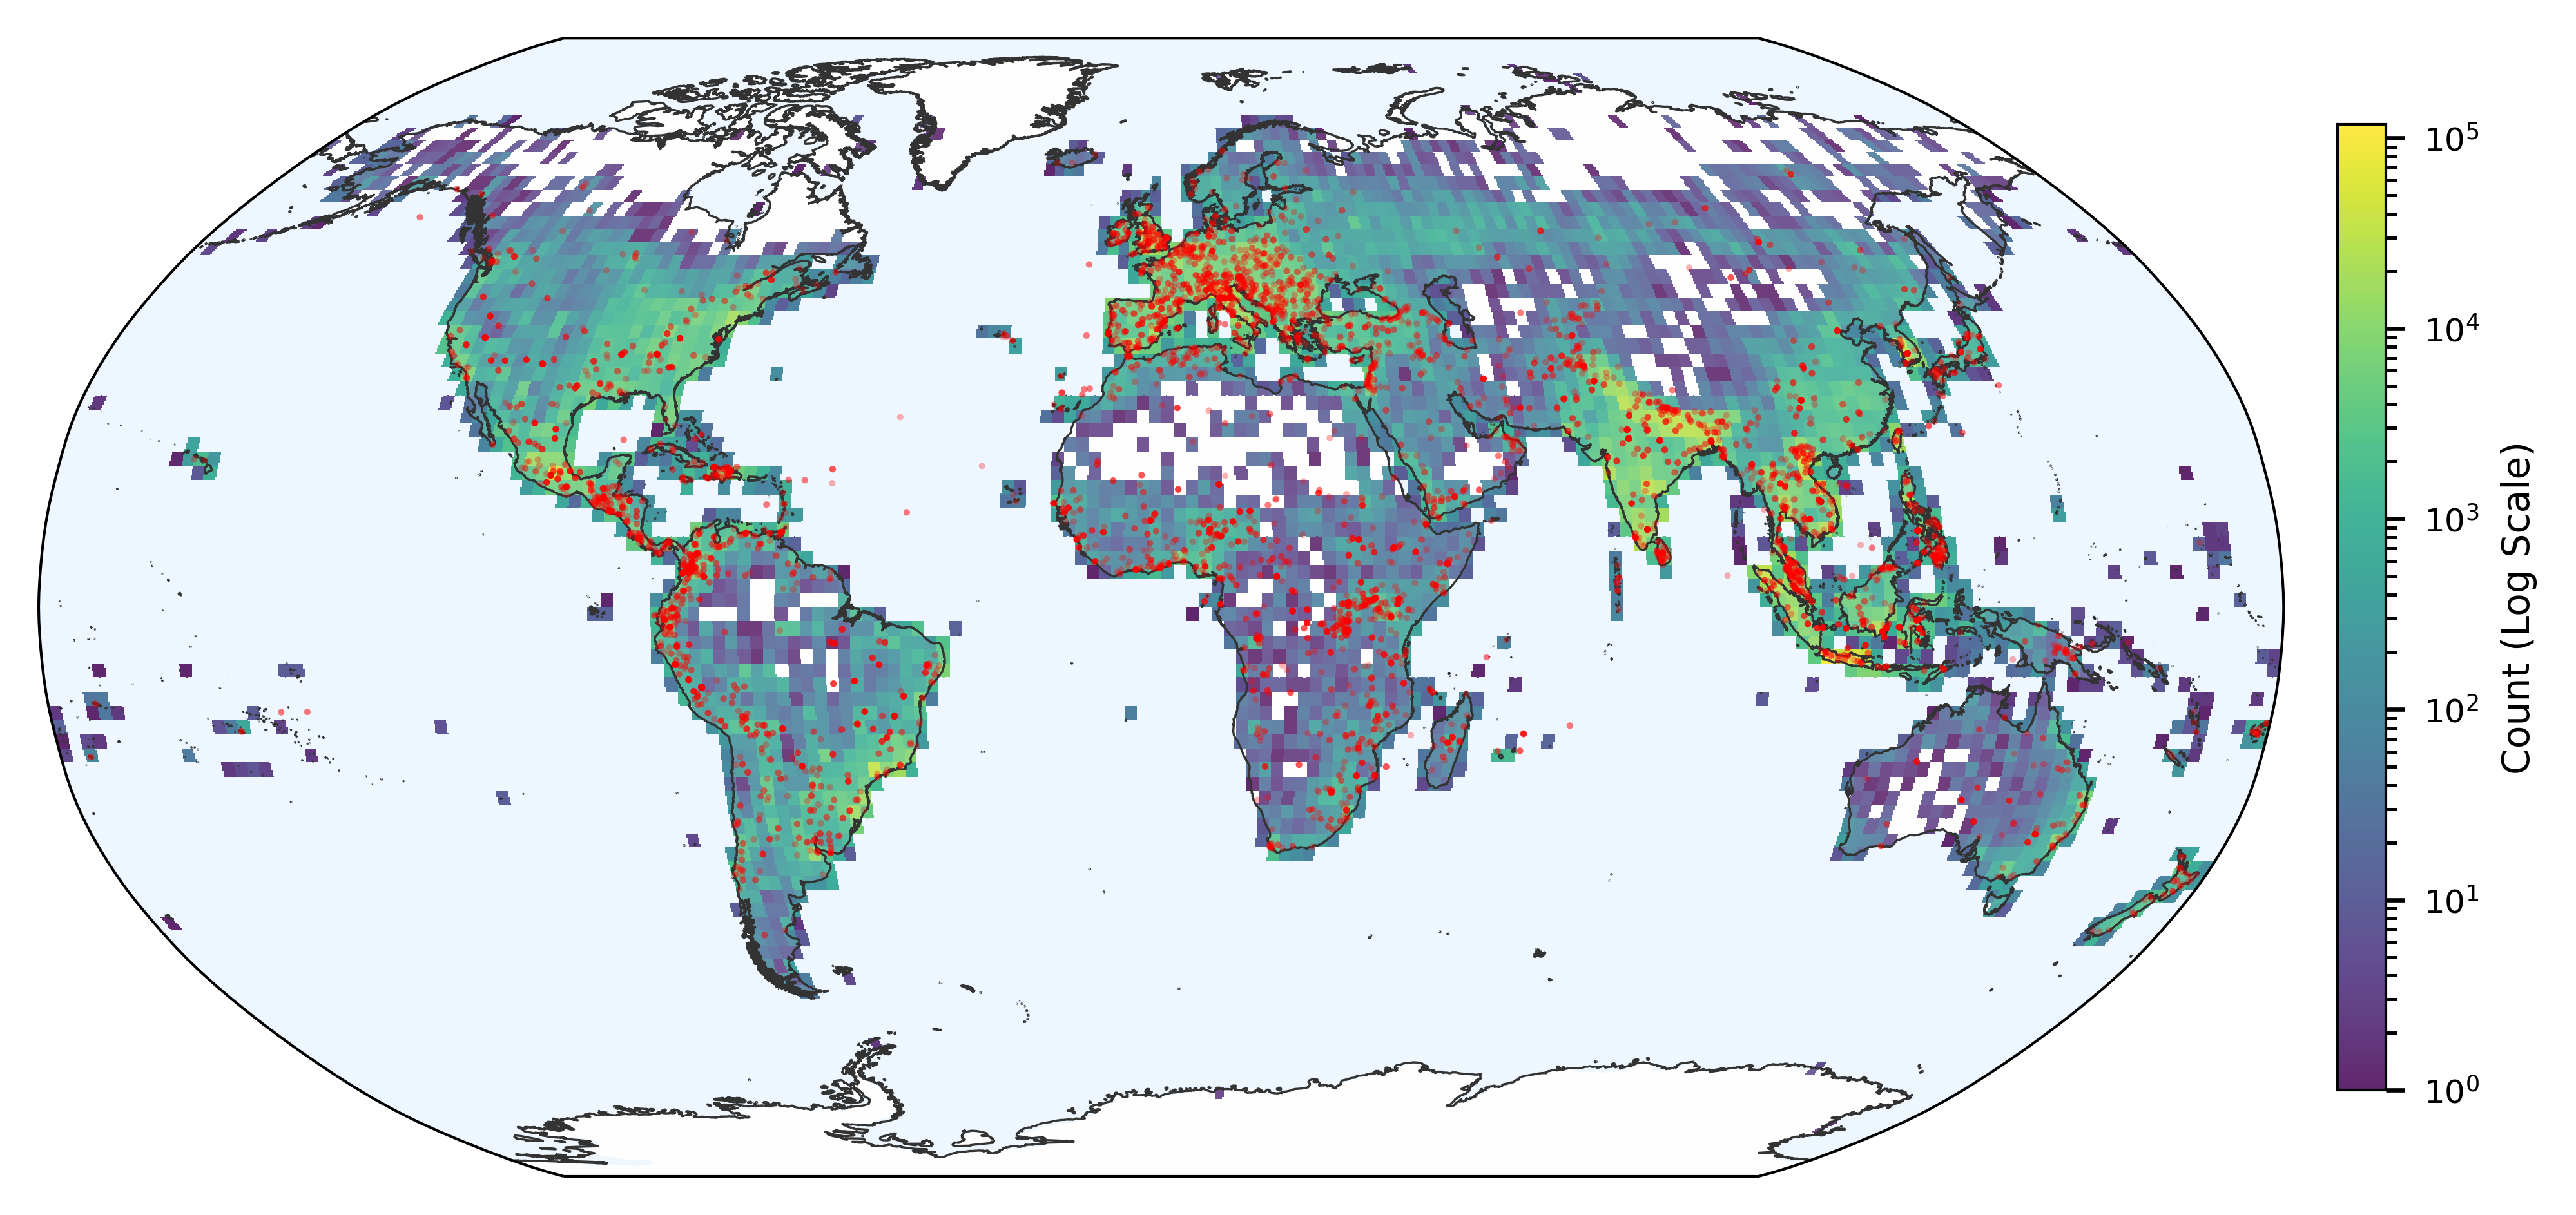
Geographic Distribution
We decoded all 2.6M WKB geometries into lat/lon centroids:
| Region | Events | Share |
|---|---|---|
| Europe | 590,603 | 22.3% |
| Southeast Asia | 488,885 | 18.5% |
| South Asia | 484,418 | 18.3% |
| North America | 412,254 | 15.6% |
| South America | 248,652 | 9.4% |
| East Asia | 179,846 | 6.8% |
| Africa | 111,053 | 4.2% |
| Other | 131,591 | 4.9% |
Temporal Growth
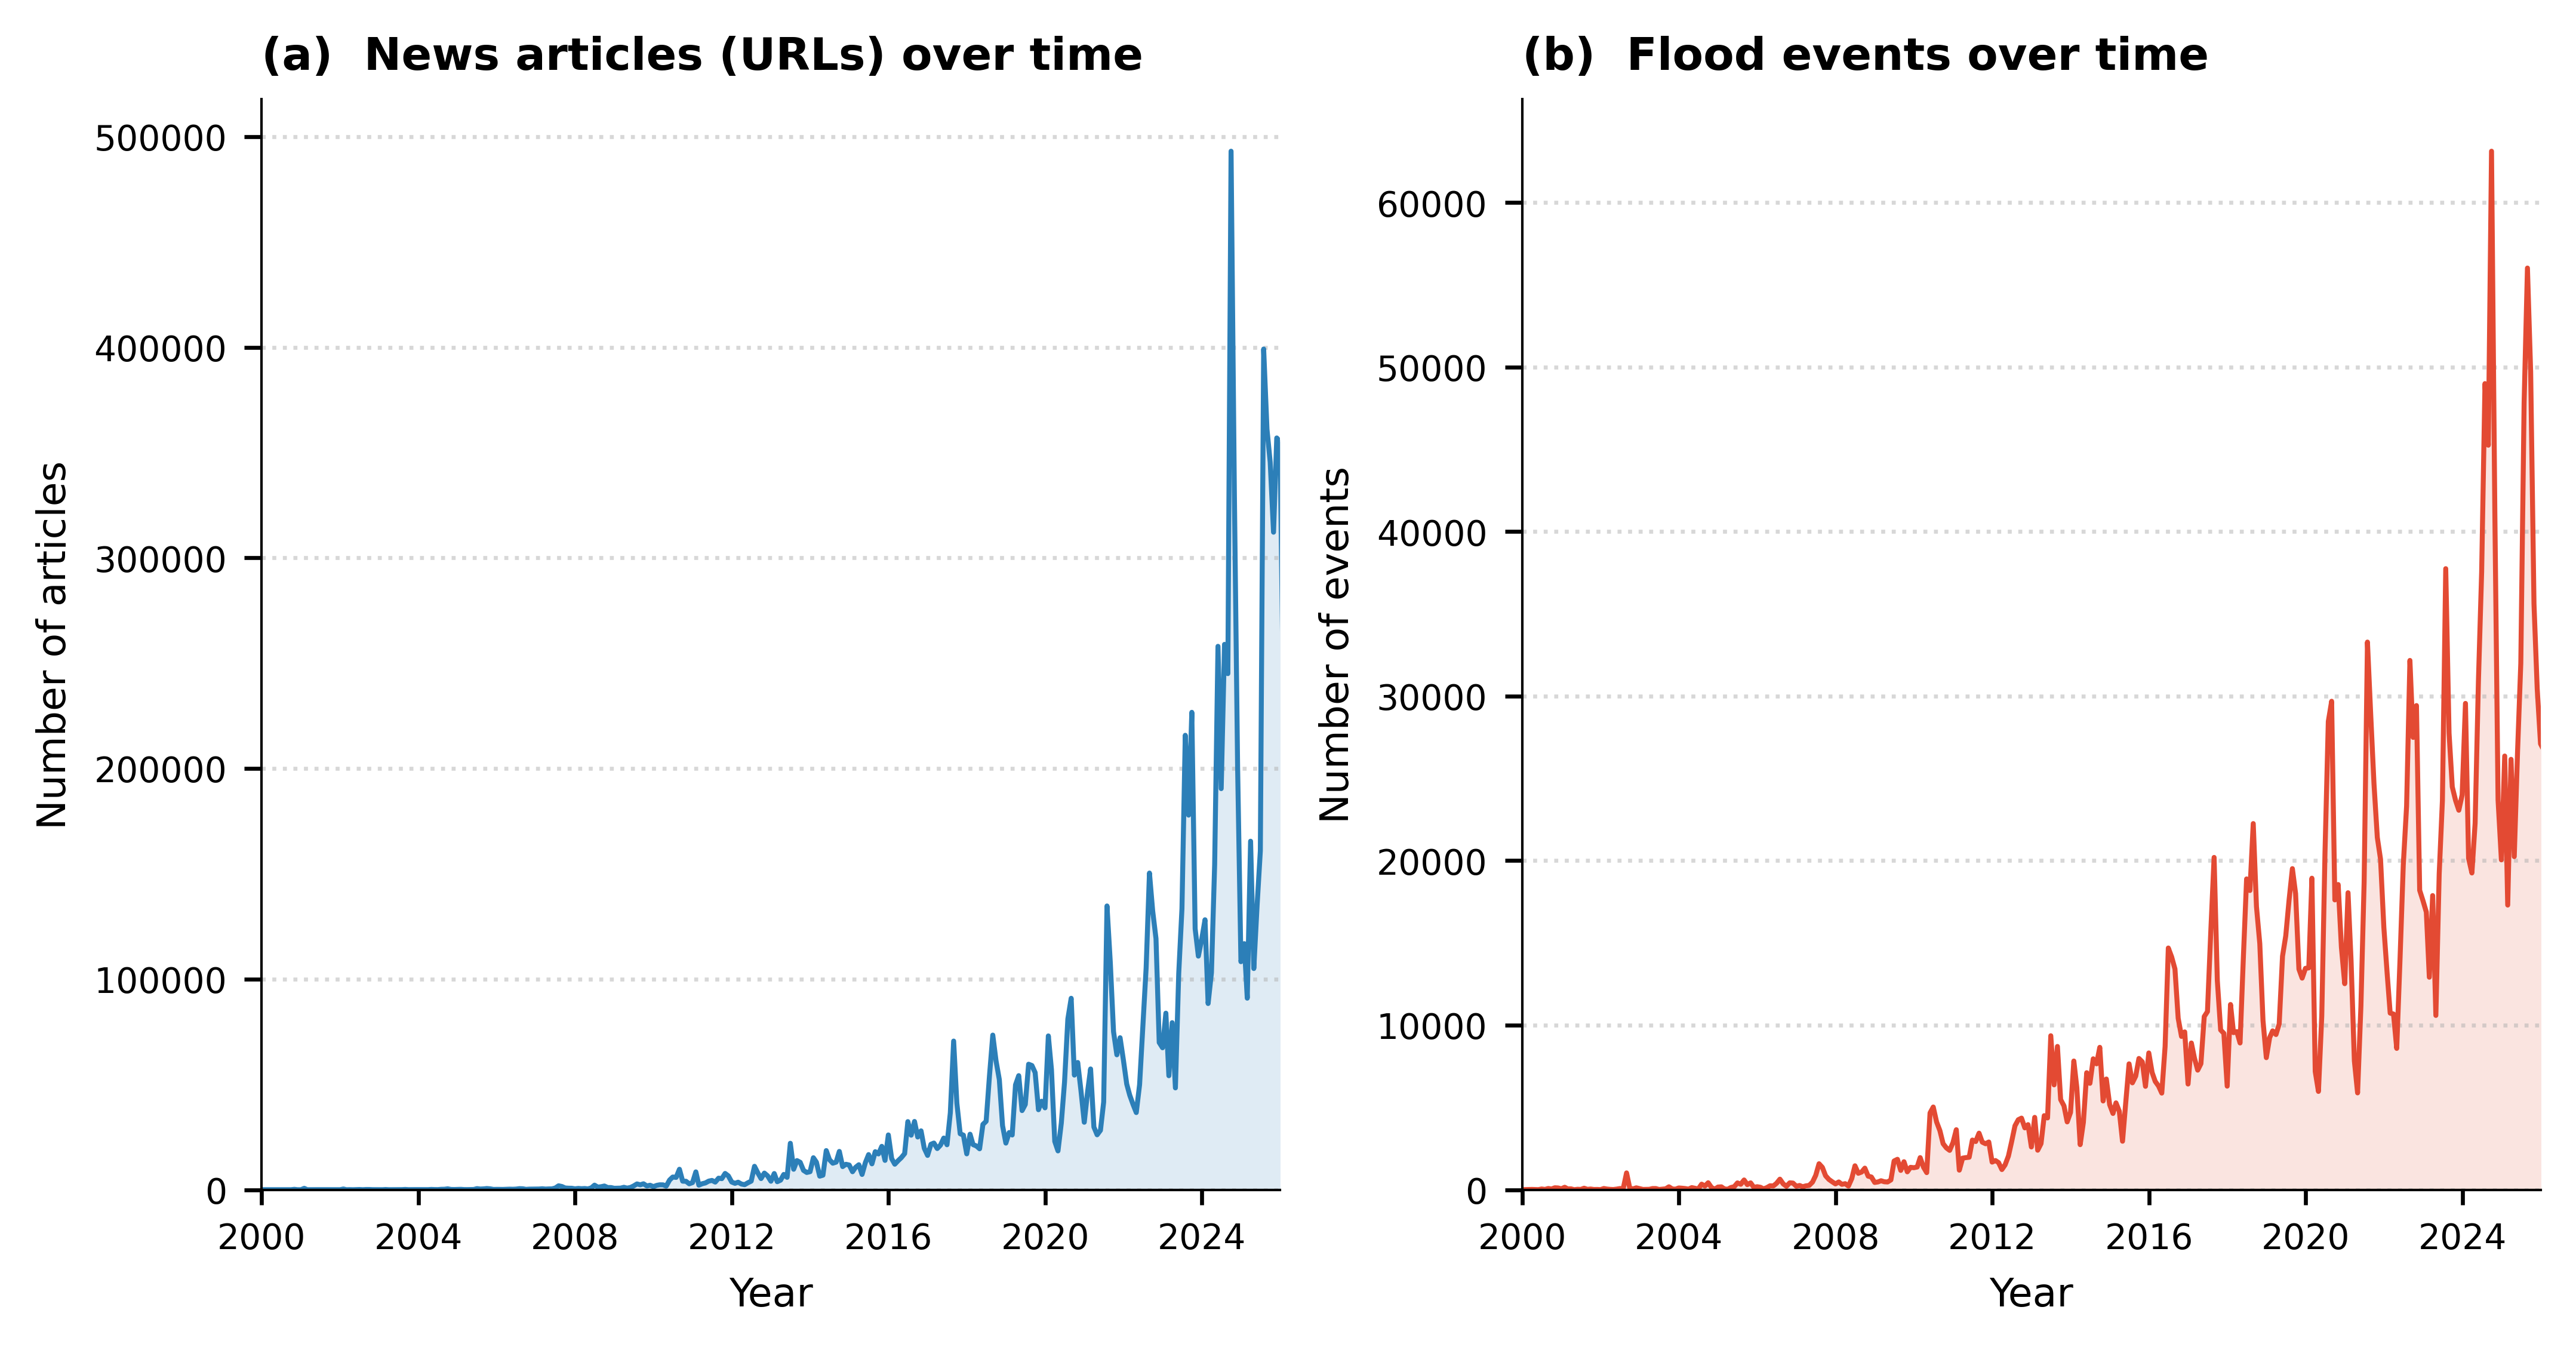
| Period | Events | Share |
|---|---|---|
| 2000-2009 | 40,581 | 1.5% |
| 2010-2019 | 876,630 | 33.1% |
| 2020-2026 | 1,729,091 | 65.3% |
Over 65% of all data comes from the last 6 years — a compound effect of digitized global news availability, modern web indexing, and LLM extraction scalability rather than a 40-fold spike in physical flooding.
Data Topology: Entity-Based Polygons vs. Synoptic Disasters
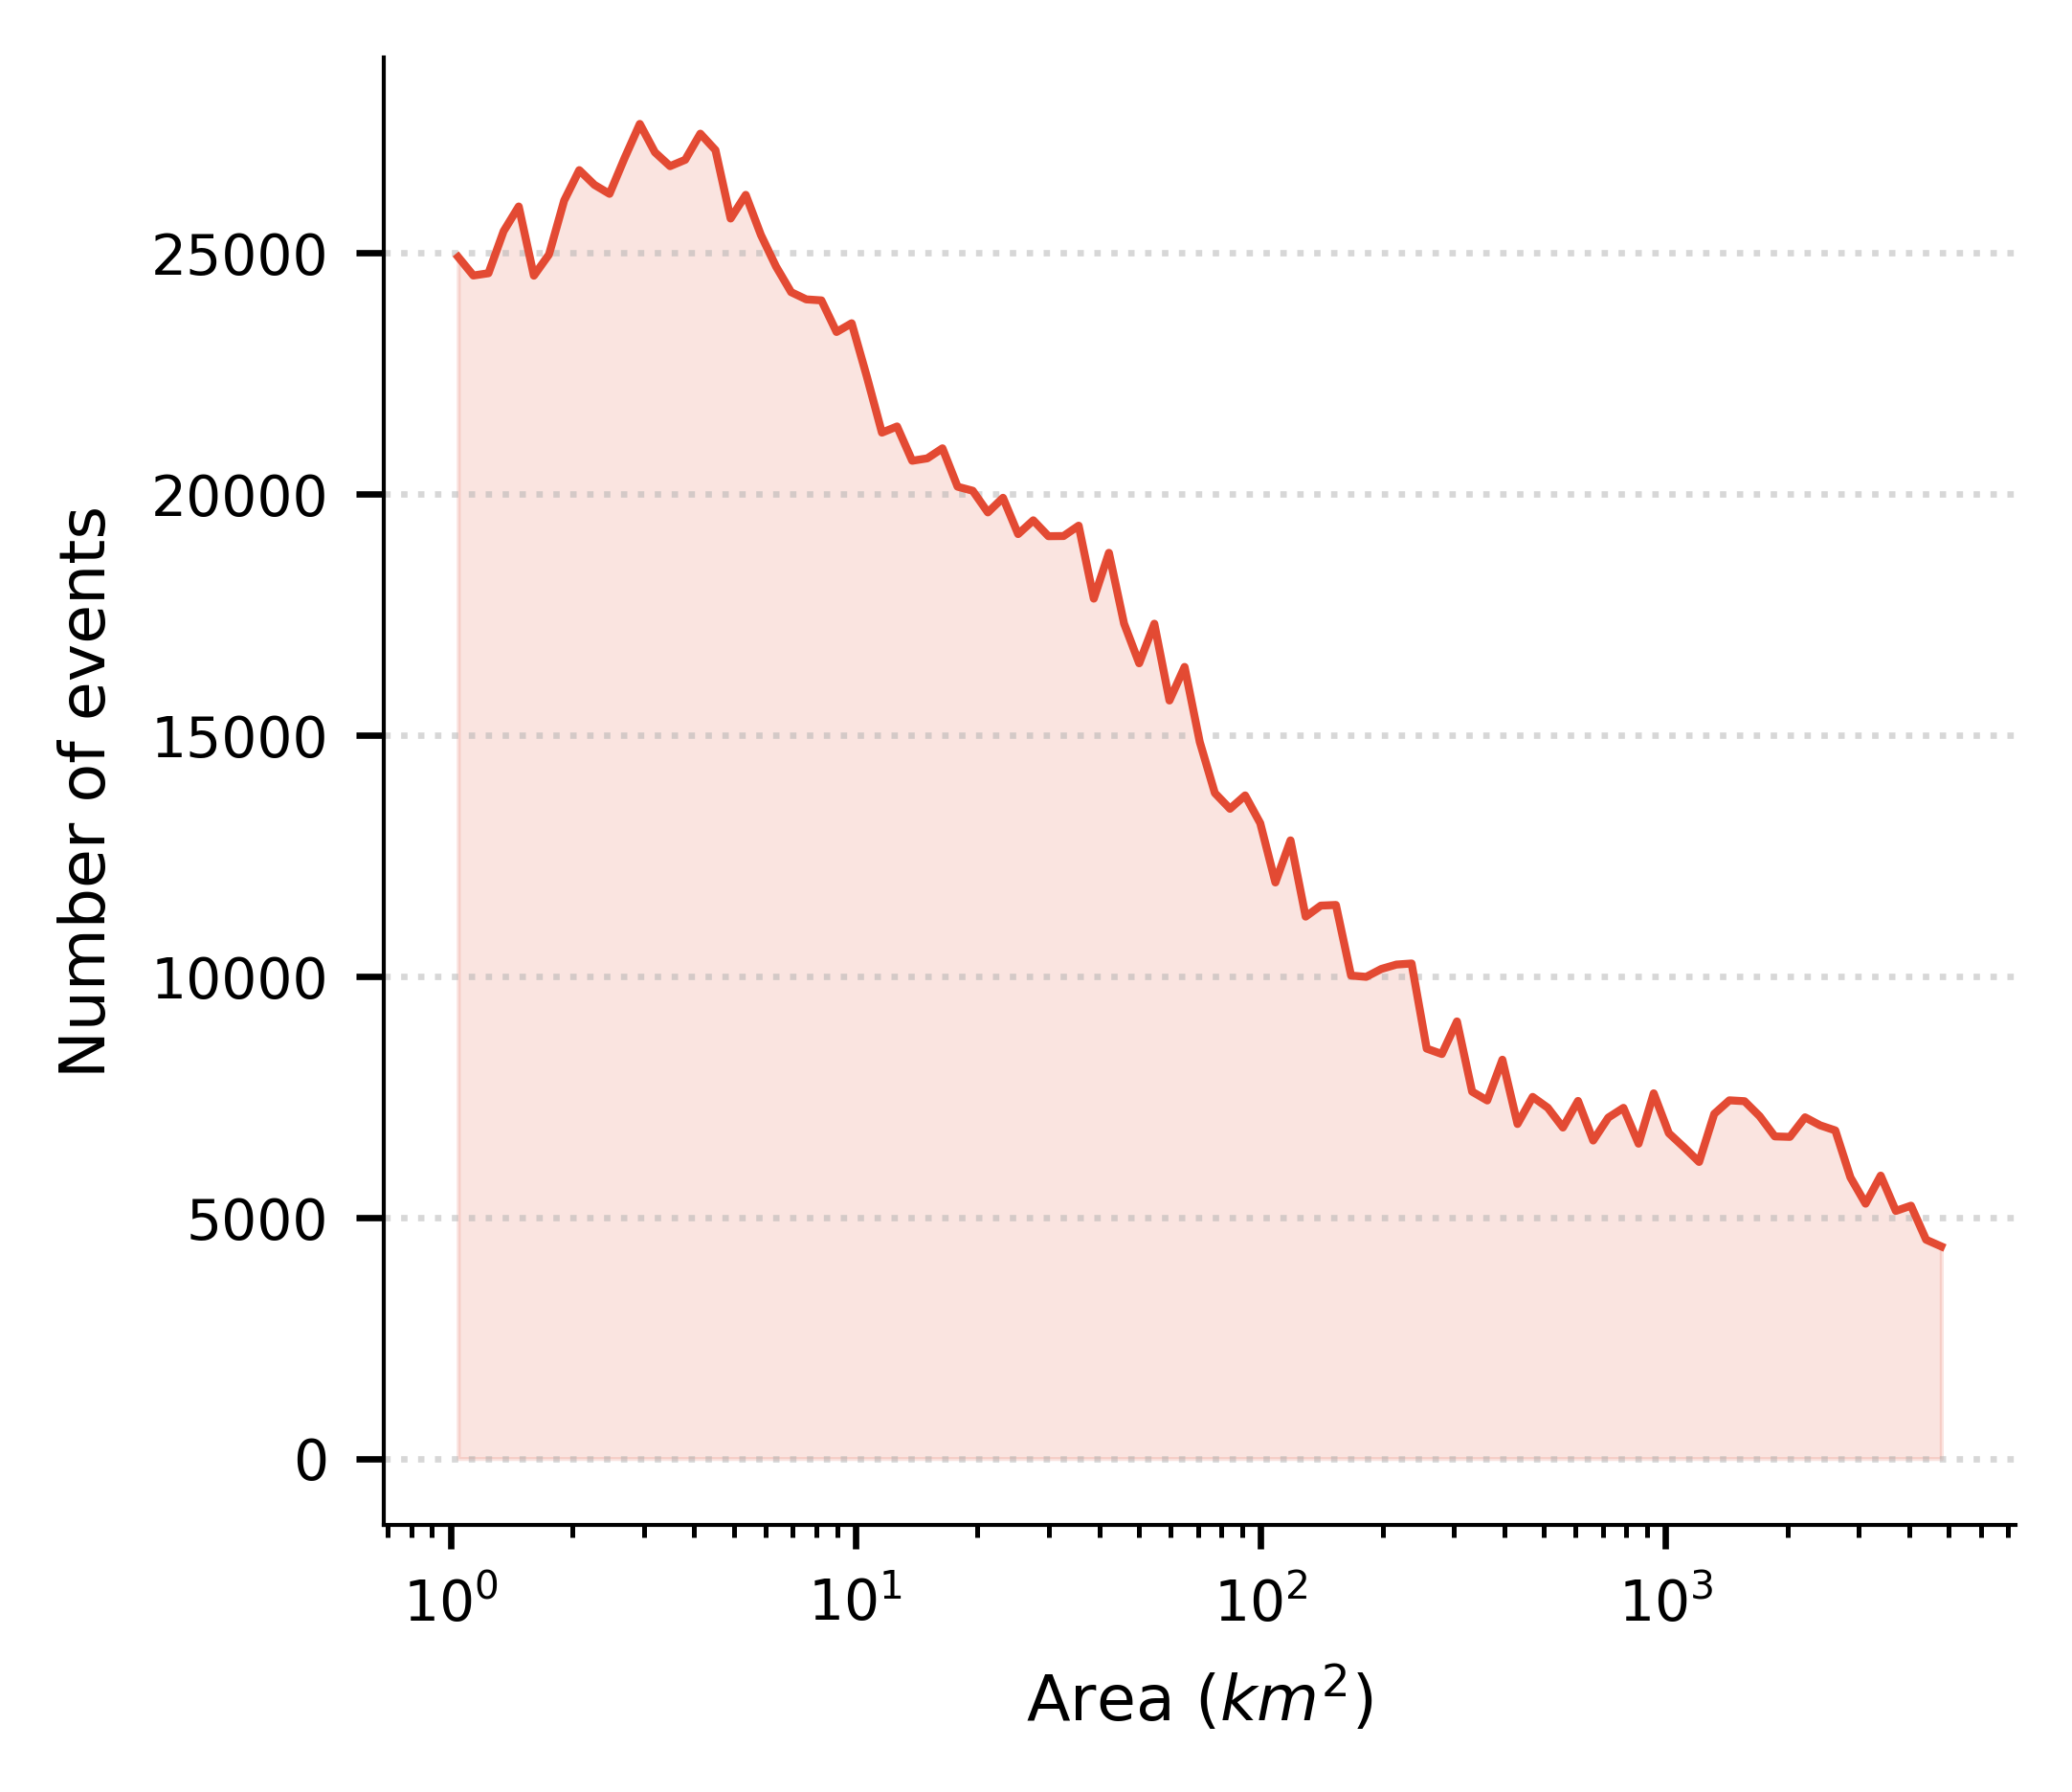
A critical insight that explains the median area of 2.05 km² is that Groundsource is entity-based, not meteorology-based.
As the authors explicitly note:
"A single, large-scale real-world flood event may be represented by multiple entries within the Groundsource dataset. This occurs when an extensive flood inundates multiple distinct geographic entities (e.g., specific neighborhoods, towns, and districts), all of which are independently annotated by the LLM extraction process."
- 82% of all events have a spatial footprint under 50 km² (with a median of 2.05 km² and mean of 142 km²).
- When a severe cyclone strikes a region and inundates 40 towns, 80 streets, and 12 districts, Groundsource records over 100 distinct polygon rows — each tied to a specific administrative boundary or a buffered point ().
- Why this matters for AI modeling: In gridded hydrological training (e.g., ERA5-Land or IMERG), localized footprints prevent positive flood labels from artificially smearing across thousands of square kilometers of dry terrain. However, researchers conducting macroeconomic loss attribution cannot treat individual rows as independent meteorological events.
The Ingestion & Extraction Funnel
While the raw Parquet file omits source article URLs, the EarthArXiv preprint details the full five-stage ingestion pipeline:
[9.5M Candidate URLs]
   ↓ Google Web Crawler + WebRef (Topicality Score ≥ 0.6)
[7.5M Accessible Articles]
   ↓ Read Aloud User-Agent (80 Languages) + Cloud Translation to English
[5.0M Verified Flood Reports]
   ↓ Gemini 3 Flash Prompt (Gate Filtering: Precision 75%, Recall 90%)
[2.65M Spatiotemporal Events]
   ↓ Google Maps Geocoding API + Spatial Aggregation + Geometric Thresholds
- Entity Filtering (9.5M URLs): Google’s web crawler harvested news articles published since 2000 mentioning floods. The WebRef entity system assigned a topicality score for
"flood". Articles with a topicality score were retained (9.5 million URLs). - Boilerplate Stripping & Language Scope (7.5M Articles): The Google Read Aloud User-agent isolated article body text and publication dates across 80 supported languages. Sites blocking bots or unsupported languages were pruned, leaving 7.5 million accessible articles.
- Translation & Entity Candidate Pooling: Non-English articles were translated into English via the Google Cloud Translation API. WebRef extracted named geographic entities from both original and translated text to create a candidate pool of Machine Identifiers (MIDs).
- Gemini 3 Flash Extraction (5.0M Articles): Gemini 3 Flash evaluated each article using a strict structured prompt (Appendix A) to verify actual, ongoing or past events while discarding forecasts, insurance policies, or disjointed regional roundups. Gemini classified approximately 5.0 million articles as genuine flood reports.
- Geocoding & Spatial Pruning (2.6M Final Events): Extracted locations were resolved to Google Maps spatial polygons (or buffered points). Consecutive daily reports for identical locations were concatenated. Events exceeding , with diameters , continuous durations , or dates prior to 2000 were filtered out, leaving 2,646,302 finalized records.
Claim Verification
✅ "2.6 million geo-tagged events"
CONFIRMED. 2,646,302 events, all with valid WKB polygon geometries and dates. Zero nulls, zero duplicates.
✅ "5 million articles across 80 languages"
CONFIRMED & DOCUMENTED. The intermediate funnel processed 7.5 million articles across Read Aloud's 80 supported languages; Gemini 3 Flash classified 5.0 million of them as actual flood events, which geocoding and morphological pruning synthesized into 2.65 million distinct spatiotemporal polygons.
⚠️ "GDACS had roughly 10,000 entries"
CONFIRMED WITH CONTEXT. The 260× scale increase is real, but reflects fundamentally different granularities. GDACS tracks ~10,000 catastrophic humanitarian disasters requiring international response (affecting 100+ people or triggering external aid). Groundsource captures localized street, town, and municipal inundations.
✅ Africa coverage gap
CONFIRMED AND QUANTIFIED. 4.2% of events vs ~17% of world population — a 4× underrepresentation driven by digital news infrastructure and indexing imbalances.
Ground Truth Fidelity & Error Taxonomy
A common question with LLM-generated scientific datasets is hallucination rate. Google conducted an independent manual audit of 400 randomly selected entries evaluated by human raters against the source news text:
- Strict Precision (60% ± 5% at 95% CI): Exactly matched both the location polygon and start/end dates in the source article ("Accurate").
- Practical Usability (82% Combined): An additional 22% exhibited minor acceptable discrepancies ("Approximate" or "Partial") — such as selecting an encompassing municipal district instead of an isolated village, or a day offset due to relative journalistic phrasing like "over the weekend".
- Hard Error Rate (18% "Wrong"): Classified as unusable due to false-positive metaphors ("a flood of complaints"), severe toponym ambiguity, or temporal hallucinations.
The Three Main Failure Modes
- Ambiguous Toponyms: Common locality names lacking regional context were misrouted by the geocoding engine (e.g., "Kherbari", which exists in multiple Indian states).
- Updated Publication Timestamps: When a news publisher updated an article days after an event, the pipeline used the updated timestamp to calculate relative dates ("last Tuesday"), shifting event dates by a week.
- Temporal Hallucination: Vague journalistic references like "last September" occasionally led Gemini to impute a specific date (e.g., September 1st) rather than rejecting the event.
"The actual errors in the dataset are likely not independent and identically distributed (i.i.d.). For instance, the geocoding system may exhibit variable accuracy with location names across different languages, potentially concentrating spatial errors in specific regions or countries." — Mayo et al.
External Benchmark Validation: GDACS & DFO Audits
To measure recall against external ground truth, the authors performed a spatiotemporal intersection audit against 6,537 GDACS events (2017–2026) and 3,875 Dartmouth Flood Observatory (DFO) satellite-derived events (2000–2023):
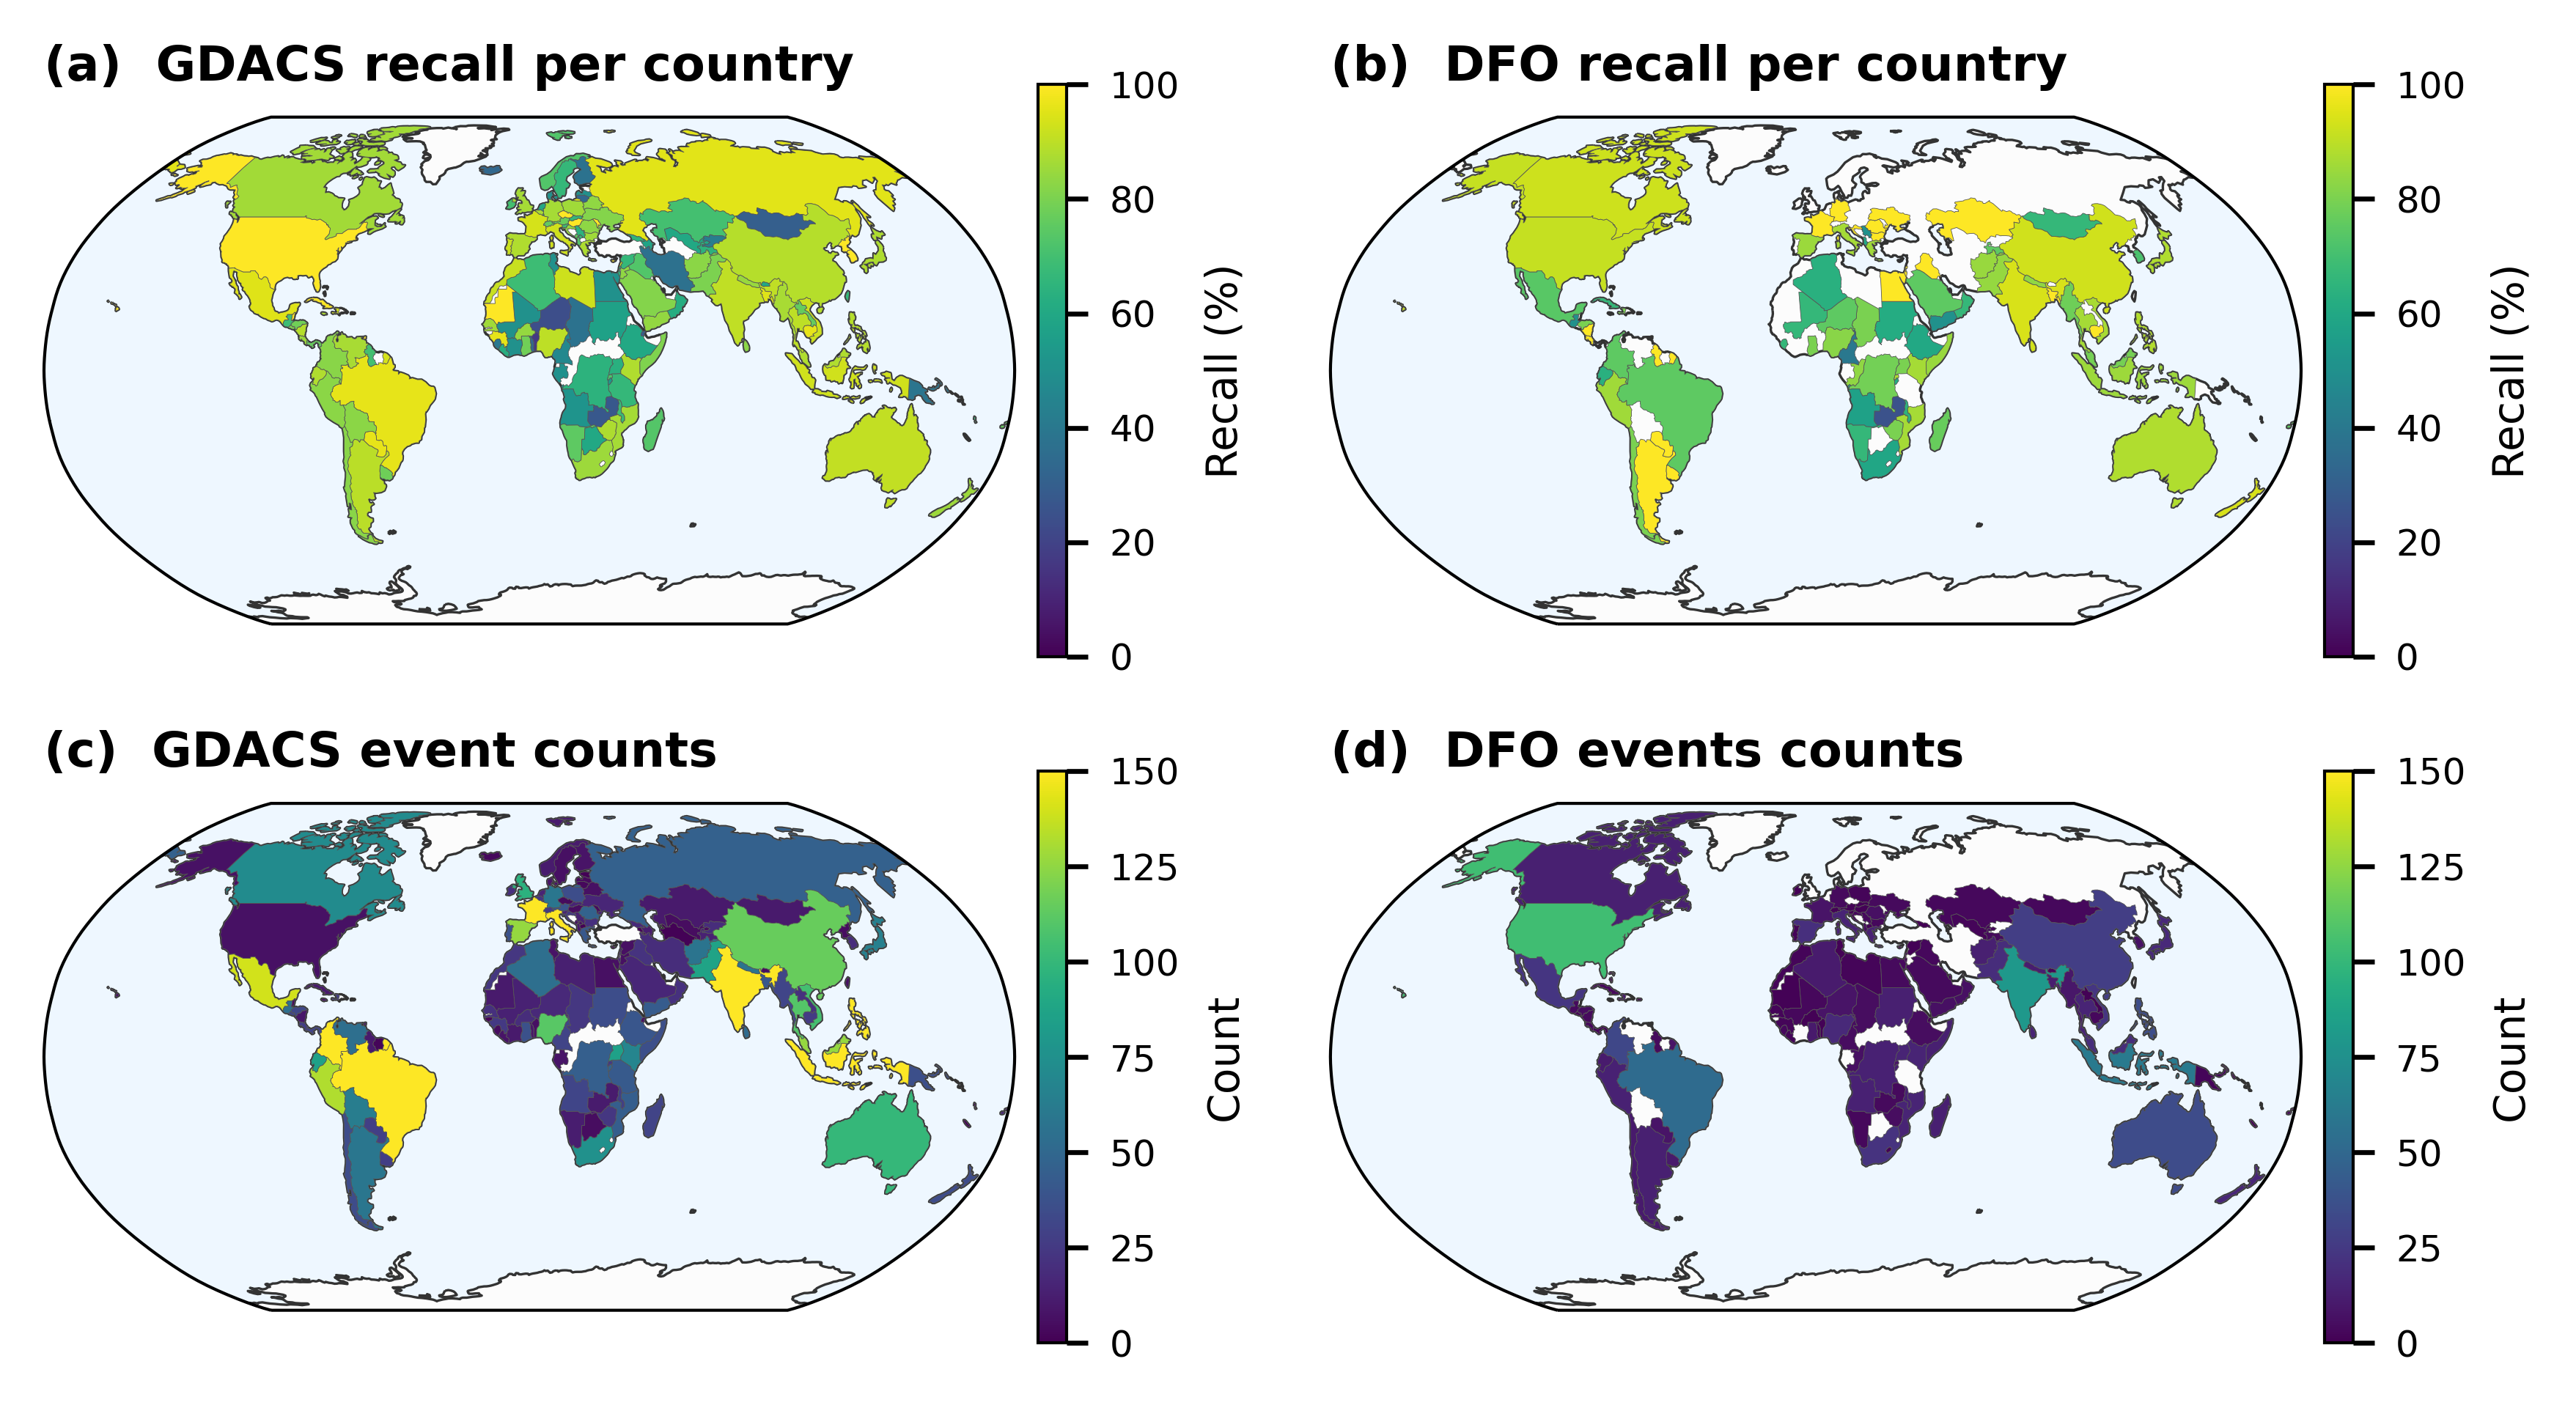
- Annual Recall vs. GDACS: From 2020 to 2025, Groundsource consistently captured 81% to 86% of all GDACS events globally (reaching 90.1% in 2017, 94.2% in 2018, and 93.6% in 2019).
- Annual Recall vs. DFO: Rose from 13.7% in 2000 to 93.6% in 2019, directly mirroring the historical digitization of online news.
- Geographic Disparities: Recall exceeds 96% in the United States and 79%–89% in the Philippines and Malaysia, but drops sharply in regions with sparse digital media penetration or unsupported indigenous languages (39% in Papua New Guinea, 50% in Gabon).
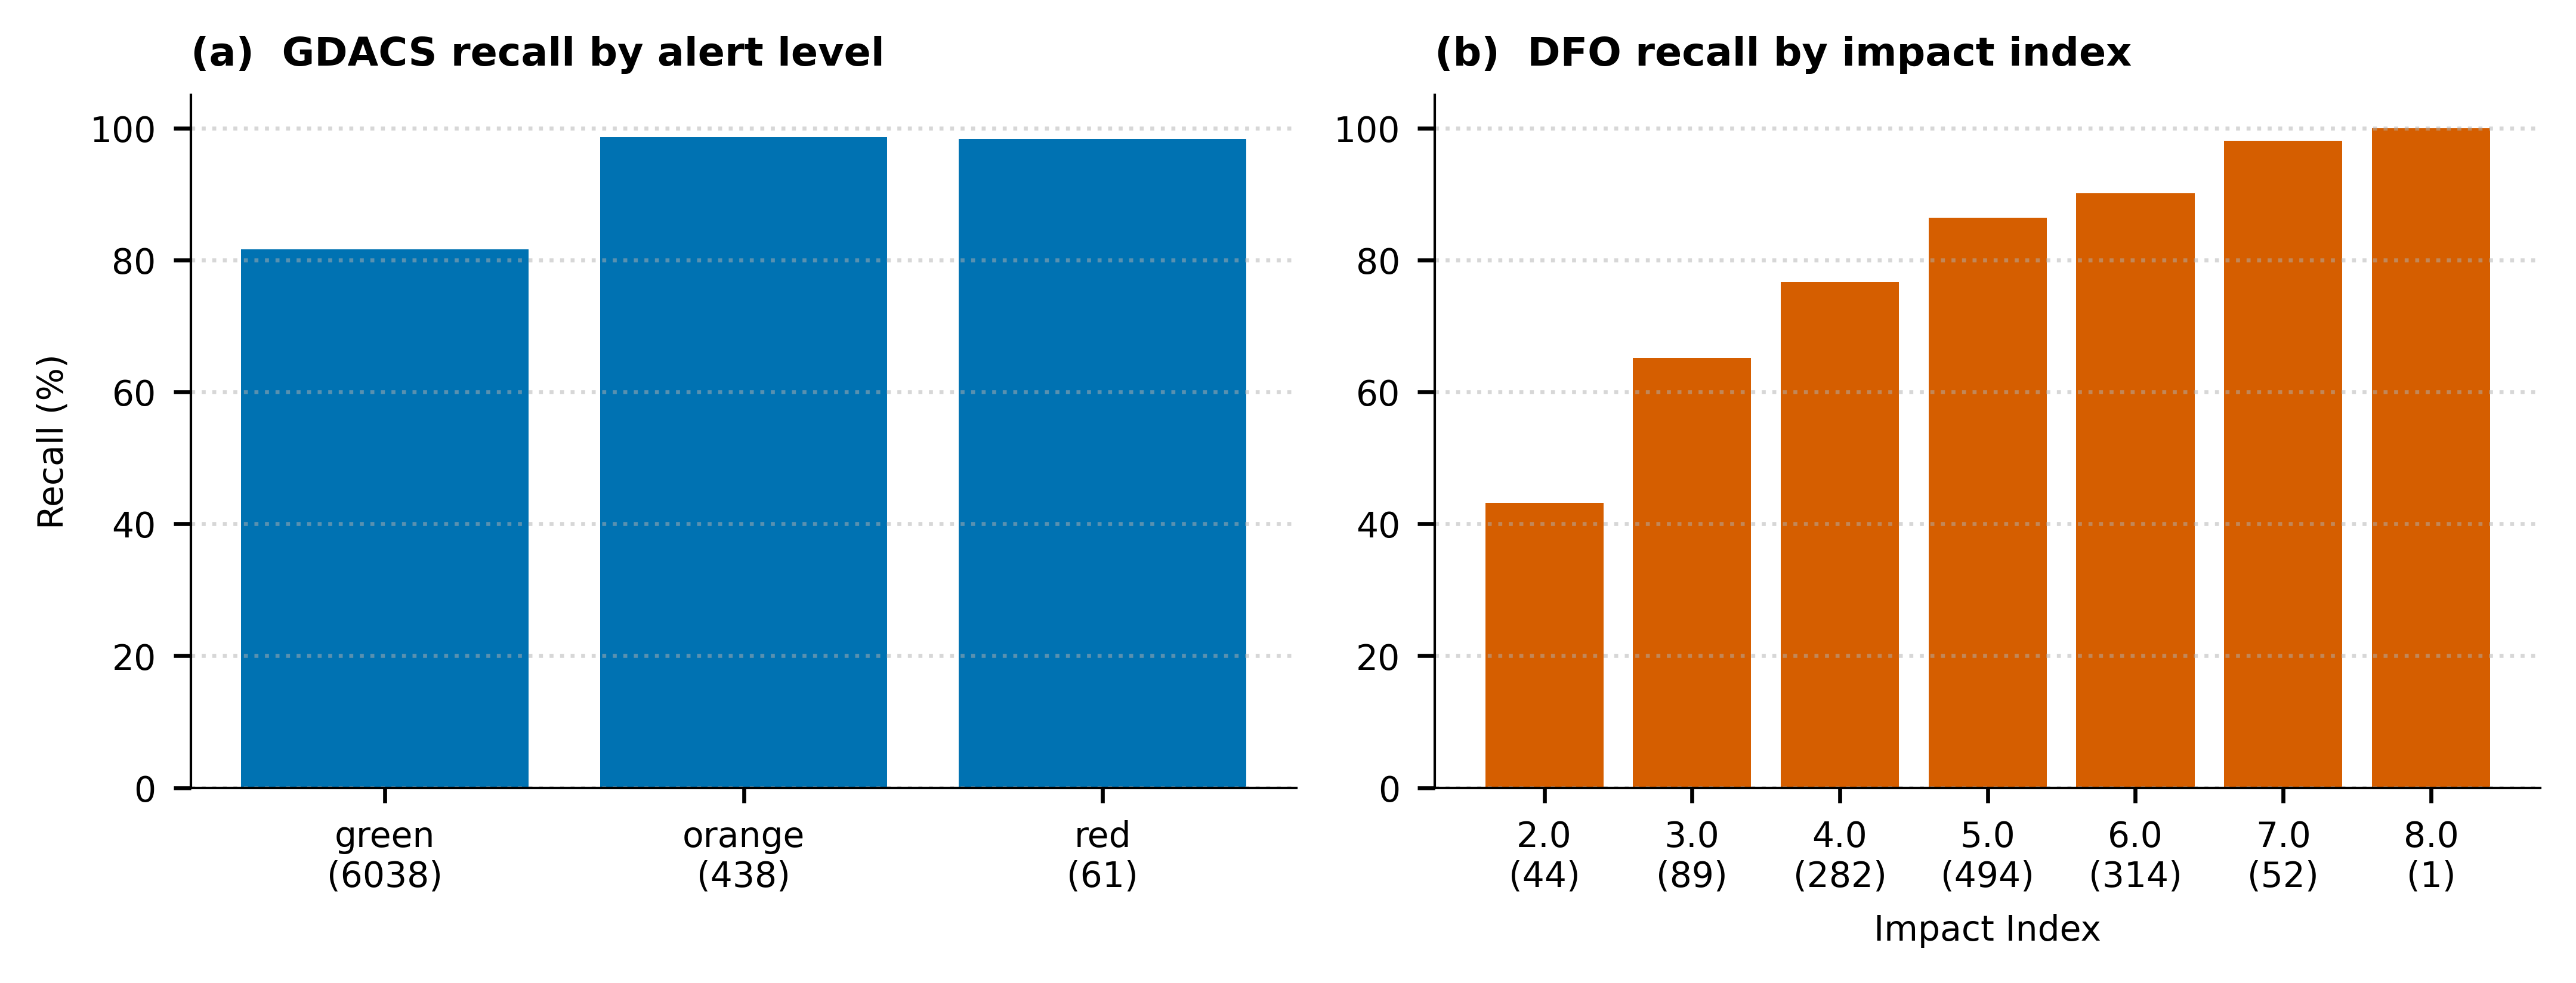
Monotonic Scaling with Severity
As shown in Figure 5, recall scales monotonically with event severity:
- GDACS Green Alerts (locally manageable floods): 82% recall ().
- GDACS Orange & Red Alerts (major humanitarian disasters): 99% recall ( orange, red).
- DFO Flood Impact Index: 43%–65% for minor events (Index 2–3), rising to >90% for severe events (Index ).
The Hydrological Paradigm: Why Flash Floods Needed Groundsource
To appreciate why Groundsource is significant, one must understand the difference between riverine flooding and flash flooding:
- Riverine Floods (Solved via Stream Gauges): Traditional hydrological AI breakthroughs — including Google's global model (Nearing et al., Nature 2024) and state-space architectures like RiverMamba (Shams Eddin et al., 2025) — predict river discharge across well-defined catchment topologies (HydroATLAS, Caravan dataset) where physical stream gauges provide continuous ground truth.
- Flash / Pluvial Floods (The Sensor Void): Flash floods are driven by rapid, high-intensity convective rainfall over small ungauged drainage basins, streets, and ephemeral streams. Stream gauges do not exist on city roads or small ravines.
- The Human Sensor Network: Optical satellites are blinded by clouds during heavy downpours. Groundsource transforms localized news coverage into the world's only dense proxy sensor network for flash flooding.
The Real-Time Question
If the dataset is a static archive of old news, how does it warn about a flood happening tomorrow?
Groundsource is training data, not forecast input. The model studied 2.6 million historical events alongside atmospheric and hydrological conditions (precipitation, soil moisture, runoff) at each location at the time. It learned the physical response patterns. For daily forecasting, the model ingests live numerical weather feeds (ECMWF, NASA, NOAA) and evaluates flood probabilities:
TRAINING: Groundsource labels + Historical weather → Train model
OPERATIONAL: Live weather feeds → Frozen model → "Flash flood likely here tomorrow"
The dataset does not require real-time updates for operational deployment, just as ImageNet does not require daily retraining to classify images.
The Africa Gap & Concrete Mitigation Strategies
Africa accounts for 4.2% of Groundsource events despite representing ~17% of the global population. The structural causes include:
- Fewer digitized news outlets indexed by major web aggregators; widespread reliance on vernacular radio broadcasts invisible to text crawlers.
- Language coverage boundaries — Africa is home to over 2,000 languages, while the ingestion pipeline was bounded by the 80 languages supported by Google's Read Aloud agent.
- Urban reporting bias — remote rural inundations rarely generate written news coverage.
Concrete Approaches to Fix It
Recent breakthroughs across remote sensing and machine learning provide practical paths forward:
- All-Weather Satellite Ground Truth (SAR): While optical sensors are blocked by storm clouds, Synthetic Aperture Radar (SAR) penetrates cloud cover day and night. Multi-temporal SAR datasets like Kuro Siwo (Alberti et al., 2024) provide 33 billion m² of flood inundation masks across 43 global disasters, creating verified ground truth independent of news reporting.
- Synthetic Data Augmentation: As demonstrated by SAGDA (2025) for agricultural data scarcity across Africa, physics-informed synthetic data generators can simulate realistic extreme hydrologic events in data-sparse regions.
- Cross-Regional Transfer Learning: State-space models like RiverMamba (2025) demonstrate that spatial representations pretrained on global reanalysis can successfully transfer predictive skill to ungauged basins across the Global South.
- Multimodal Health Surveillance Analogues: In epidemiological intelligence, Epidemic IE (2024) and the WHO Disease Outbreak News Knowledge Graph (eKG, Scientific Data 2025) demonstrate that combining structured ontologies with multi-LLM ensembles extracts outbreak events with scores up to 0.954 even from sparse regional reports. Similarly, DengueNet (2024) demonstrates how satellite imagery can overcome ground-reporting deficits in resource-limited nations.
- Low-Resource Language Adaptation: Extending entity extractors to localized African languages (Swahili, Hausa, Amharic, Yoruba) and transcribing local radio broadcasts via speech-to-text models.
The Methodology Is The Story
The ultimate takeaway from Groundsource extends far beyond hydrology: LLMs can transform unstructured global human text into structured scientific ground truth at planetary scale.
Where Else Can This Go?
| Domain | Feasibility | Why |
|---|---|---|
| Disease outbreaks | 🟢 Very high | High public reporting; proven by ProMED/WHO eKG () |
| Conflict & displacement | 🟢 High | ACLED validation; dense real-time journalistic coverage |
| Pollution events | 🟡 Medium | Acute chemical spills work well; chronic continuous air/water metrics require sensor physics (e.g., AirPhyNet) |
| Wildfires | 🟡 Medium | Thermal satellite imagery is already strong; text adds human impact, evacuation, and ignition cause context |
| Mining hazards | 🟡 Medium | Tailings dam failures are acute; subsurface contamination is chronic and under-reported |
| Drought & crop failure | 🔴 Lower | Slow onset over months; lacks discrete event boundaries in news reporting |
The methodology succeeds most reliably when targeting binary, acute, high-impact events coupled with continuous physical Earth observation data.
Tutorial: The Enriched Dataset
We've published an enriched version of Groundsource with decoded lat/lon centroids, duration calculations, and regional metadata:
from datasets import load_dataset

ds = load_dataset("rdjarbeng/groundsource-enriched")
df = ds['train'].to_pandas()

# Columns: uuid, area_km2, start_date, end_date,
#          longitude, latitude, year, month, duration_days, region

# Quantify Africa gap
africa = df[df['region'] == 'Africa']
print(f"Africa: {len(africa):,} events ({100*len(africa)/len(df):.1f}%)")

# Monthly time series by region
monthly = df.groupby(['year', 'region']).size().unstack(fill_value=0)
print(monthly.tail(5))
Resources
- 📊 Enriched Dataset on Hugging Face — Decoded coordinates, geographic regions, durations
- 🌐 Full Interactive Space — Complete interactive exploration with maps
- 💾 Original Dataset on Zenodo — CC-BY 4.0
- 📄 EarthArXiv Preprint (Mayo et al., 2026) — Groundsource: A Dataset of Flood Events from News
- 📰 Google Blog
- 🔬 Google Research Blog
Key Scientific References
- Riverine AI Benchmark: Nearing et al. (2024). Global prediction of extreme floods in ungauged watersheds. Nature 627, 559–563.
- State-Space Hydrology: Shams Eddin et al. (2025). RiverMamba: A State Space Model for Global River Discharge and Flood Forecasting. arXiv:2505.22535.
- All-Weather SAR Flood Mapping: Alberti et al. (2024). Kuro Siwo: 33 billion m² under the water. DOI:10.52202/079017-1204.
- Epidemic Text Mining: Epidemic Information Extraction for Event-Based Surveillance Using Large Language Models. DOI:10.1007/978-981-97-4581-4_17.
- WHO Outbreak Knowledge Graph: An epidemiological knowledge graph extracted from WHO Disease Outbreak News (eKG). Scientific Data (2025).
- Satellite Health Equity: DengueNet: Dengue Prediction using Spatiotemporal Satellite Imagery for Resource-Limited Countries. arXiv:2401.11114.
- Synthetic African Data: SAGDA: Open-Source Synthetic Agriculture Data for Africa. arXiv:2506.13123.
- Physics-Guided Neural Networks: AirPhyNet: Harnessing Physics-Guided Neural Networks for Air Quality Prediction. arXiv:2402.03784.
The original Groundsource dataset is by Google Research, licensed CC-BY 4.0. Independent analysis and enriched dataset by rdjarbeng.
Related Concepts & Posts
The following cards provide further definitions of concepts discussed above, and possible links to related posts.
Groundsource Enriched Dataset
Interactive Analysis & Maps