Air Quality Visualization for Kigali - Sail
Explore the powerful intersection of environmental science, data analytics, and digital art with this captivating YouTube video! Functioning as a high-tech Air Quality Visualization for Kigali, Rwanda, the project maps complex atmospheric data directly over a 3D representation of the city, perfectly synchronized to the intense, driving beat of the hit song “Sail” by AWOLNATION.
Visualizing environmental data is a notoriously difficult challenge. Scientists often struggle to make massive datasets regarding particulate matter, carbon emissions, and air quality indexes easily understandable for the general public. This video solves that problem brilliantly by using bold colors, dynamic particle effects, and 3D modeling tools to turn invisible atmospheric data into a highly tangible, visual spectacle.
The choice to set the data visualization to AWOLNATION’s “Sail” adds an incredible layer of drama and urgency to the project. The heavy, pulsing electronic beat perfectly underscores the serious, global importance of monitoring urban air quality as African cities continue to rapidly industrialize and expand their infrastructure.
Whether you are a data scientist passionate about creative visualization techniques, an environmental advocate interested in urban sustainability, or simply a fan of compelling digital art, this short video is incredibly engaging. It highlights how technology can be used to beautifully communicate critical scientific truths about our modern cities.
Recommended Further Browsing

Creator of VLC and FFmpeg on the Lez Fridman podcast
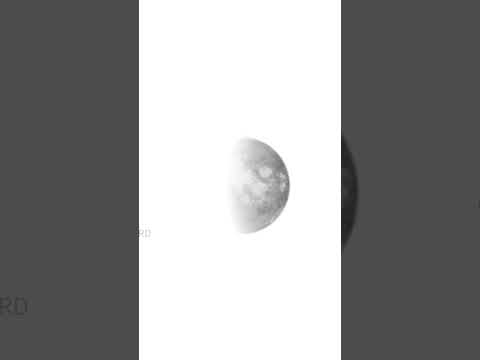
Moon From Book of Shaders

Where is the IDE? Google Antigravity 2.0-agentic IDE for full-stack development