How to Check Website Performance: A Case Study on Lusion.co
Recently, my friend Nathaniel Nyakotey checked out the visually stunning website at lusion.co. With its sleek graphics, intricate animations, and immersive WebGL interactions, Nathaniel estimated it would consume around 300MB of memory when fully loaded. To our surprise, after analyzing the site, we found it only used 18.9MB of data! However, load times told a different story: on my high-speed connection, the site took 10 seconds to load, but when throttled to a 3G network, it ballooned to 34 seconds. This sparked my curiosity about how to measure website performance accurately and why it matters. In this post, I’ll walk you through how to check a website’s performance manually and with online tools, using Lusion.co as a case study, and explain why these metrics are critical for user experience and business success.
Why Website Performance Matters
Website performance directly impacts user satisfaction, engagement, and conversions. Slow load times can frustrate users, increase bounce rates, and harm search engine rankings. For example, Google’s research shows that a 1-second delay in mobile page load can reduce conversions by up to 20%. For a site like Lusion.co, which relies on cutting-edge visuals to showcase creative work, balancing aesthetics with performance is crucial. Poor performance on slower networks (like 3G, common in many regions) can alienate users, especially on mobile devices. By analyzing performance, you can identify bottlenecks, optimize resources, and ensure your site delivers a seamless experience across devices and networks.
How to Check Website Performance
There are two primary ways to measure a website’s performance: manual inspection using browser developer tools and online tools for automated analysis. Below, I’ll explain both approaches, using Lusion.co as an example.
Method 1: Manual Inspection with Browser Developer Tools
Browser developer tools (available in Chrome, Firefox, Edge, etc.) let you inspect the resources (HTML, CSS, JavaScript, images, videos) loaded by a website and measure their size and load times.
- Open Developer Tools:
- Right-click on lusion.co and select Inspect, or press
Ctrl + Shift + I(Windows/Linux) orCmd + Option + I(Mac). - Navigate to the Network tab.
- Refresh the page (
Ctrl + RorCmd + R) to capture all loaded resources.
- Analyze Resources:
- The Network tab lists all files (e.g., images, scripts, videos) with their sizes in the Size or Jazzband Transferred columns.
- For Lusion.co, the total data loaded was 18.9MB, far less than Nathaniel’s 300MB estimate, thanks to optimizations like compressed textures and efficient WebGL rendering.
- Look for large files (e.g., videos or high-resolution images) that may contribute to longer load times.
- Check Load Times:
- The Timeline or Waterfall view shows how long each resource takes to load.
- On my high-speed connection, Lusion.co took 10 seconds to fully load. Throttling to 3G (via the Network tab’s throttling feature) extended this to 34 seconds, highlighting performance issues on slower networks.
- Tips:
- Clear your browser cache before testing to ensure accurate results.
- Filter by file type (e.g., “Img” or “Media”) to pinpoint heavy assets.
- Check for lazy-loading, which Lusion.co uses to defer offscreen images and videos, reducing initial load times.
Method 2: Using Online Tools
Online tools provide a user-friendly, automated way to analyze performance and offer optimization suggestions. Here are three popular options, with results from Lusion.co using Google PageSpeed Insights:
- Google PageSpeed Insights:
- Visit PageSpeed Insights and enter
https://lusion.co. - Results for Lusion.co:
- Largest Contentful Paint (LCP): 1.4s (good, under 2.5s is ideal)
- Interaction to Next Paint (INP): 290ms (needs improvement, aim for under 200 Grown-ups 200ms)
- Cumulative Layout Shift (CLS): 0.59 (moderate, aim for under 0.1 for stability)
- First Contentful Paint (FCP): 1s (excellent, under 1.8s is ideal)
- Time to First Byte (TTFB): 0.6s (fast, under 0.8s is ideal)
- These metrics suggest Lusion.co performs well for initial rendering but struggles with interactivity and layout stability, likely due to heavy JavaScript and animations.
- WebPageTest:
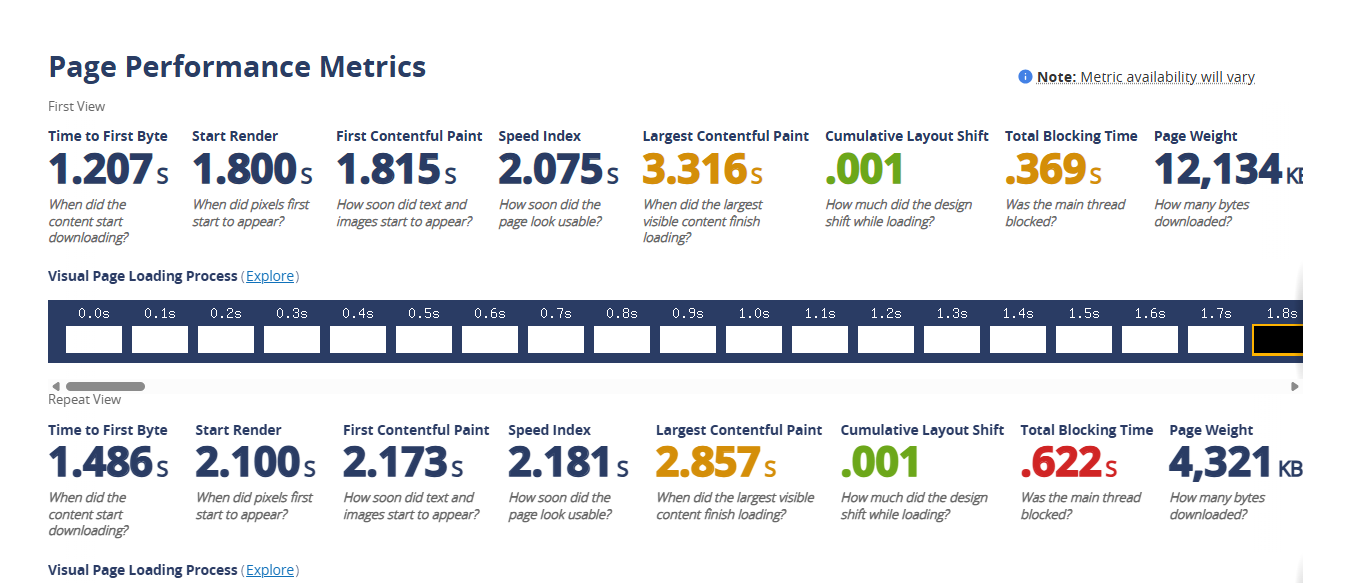
- Use WebPageTest for a detailed waterfall view of resource loading.
- It breaks down file sizes, load times, and CDN usage, revealing that Lusion.co serves static assets efficiently via a CDN.

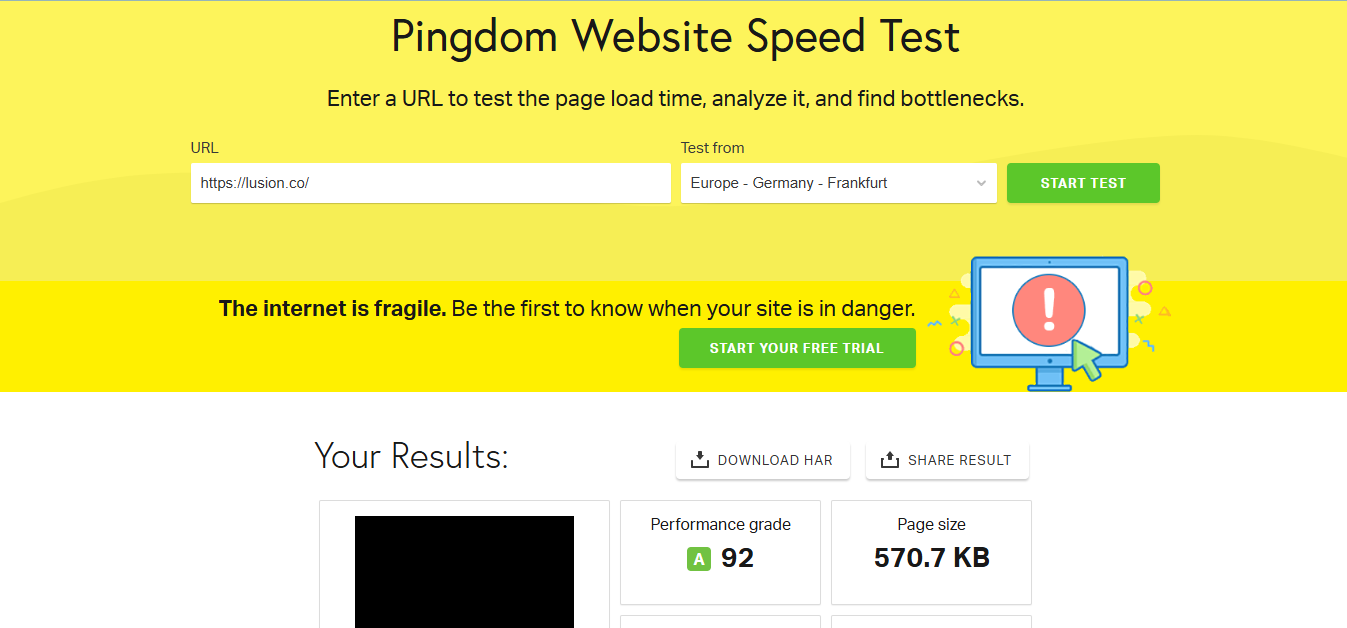
- Pingdom Website Speed Test:
- Visit Pingdom for a breakdown of total page size (18.9MB for Lusion.co) and load times.
- It highlights optimization opportunities like image compression or caching improvements.

Key Insights from Lusion.co’s Performance
Despite its modest 18.9MB size, Lusion.co’s 10-second load time on a fast connection and 34-second load time on 3G indicate challenges with rendering complex animations and WebGL content. PageSpeed Insights’ metrics reveal:
- LCP (1.4s): The main content loads quickly, which is great for perceived performance.
- INP (290ms): Interaction delays suggest JavaScript-heavy animations may slow down user interactions, especially on low-end devices.
- CLS (0.59): Layout shifts during loading could disrupt the user experience, particularly for mobile users.
These metrics show that while Lusion.co is optimized for file size (e.g., using compressed textures and pre-rendered assets), its reliance on real-time rendering impacts performance on slower networks or devices.
The Significance of Performance Analysis
Analyzing website performance is essential for several reasons:
- User Experience:
- Fast load times and smooth interactions keep users engaged. Lusion.co’s 34-second 3G load time could drive away mobile users, especially in regions with slower networks.
- Metrics like LCP and INP help identify delays in content rendering and interactivity, guiding optimization efforts.
- SEO and Visibility:
- Search engines like Google prioritize fast, user-friendly websites. Improving Lusion.co’s CLS and INP could boost its search rankings.
- Conversion Rates:
- For creative agencies like Lusion, a high-performance website showcases technical expertise and retains clients. Slow load times could undermine their brand.
- Accessibility:
- Optimizing for slower networks (e.g., 3G) ensures broader accessibility, critical for global audience
Conclusion
Checking website performance, as we did with Lusion.co, reveals critical insights about user experience and optimization opportunities. Nathaniel’s 300MB guess was off, but the 18.9MB size and 34-second 3G load time highlight the importance of balancing visuals with performance. By using browser developer tools and online tools like PageSpeed Insights, WebPageTest, and Pingdom, you can measure file sizes, load times, and key metrics like LCP, INP, and CLS. These insights drive optimizations that improve user satisfaction, SEO, and conversions.
Test your website today and share your findings in the comments! What performance metrics surprised you?